

Editor’s note: We invited economist Natalie Gochnour to the Deseret News editorial board to help us understand more clearly the state of Utah’s economy as it works through the ongoing impact of COVID-19. She took us through the numbers and we share that with you today.
Deseret News: Can you give us an economic overview?
Gochnour: So in terms of a forecast — and I have to make a big assumption that we get a second federal stimulus and no major economic shutdown — then we would say the worst is over, that April 2020 was the peak job loss. Don’t expect a V-shaped recovery but rather a checkmark or a swoosh. The impacts will continue to be uneven. And that’s by socioeconomic, by industry, by race, by geography. We’ll see more disruptions. We’re in a disruption right now. I think we’ll see more but not as severe. And that’s because April was such an overwhelming bodyblow that seemingly came out of nowhere with no preparation, no adaptations, which we’ve now been able to put in place.
Our recovery very much depends on our actions, and what policies are put in place, and certainly medical science, and then we will see structural changes on their way.
Chart 1. Unemployment rate
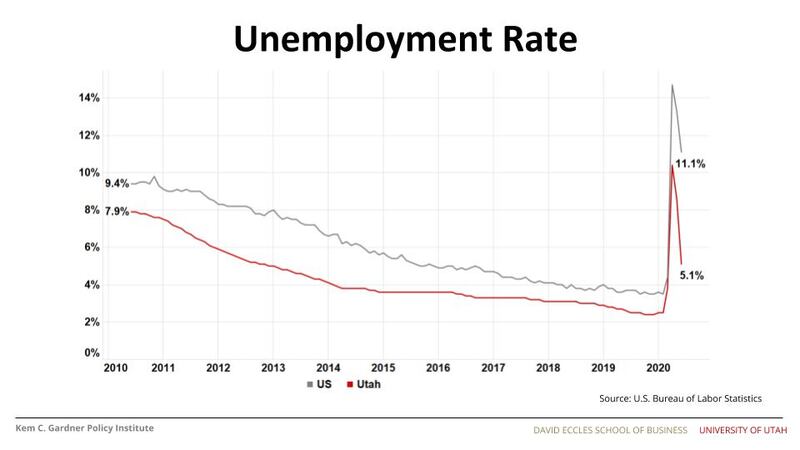
This is what our unemployment rate looks like today. This jobs report just came out on July 17, so this is very recent data. Utah is in red and the U.S. in gray. Our unemployment rate dropped to 5.1%. That was an incredible surprise to really all of us to see it drop that quickly. And it says something about the degree to which our economy reopened. The governor called it a dial, but we treated it like a switch. And, you know, maybe we will live to regret that a bit.
Deseret News: Is that unemployment number, in fact, an indictment of us when we see corresponding increases in COVID-19 cases? Did Utah as a state open too quickly?
Gochnour: I think it is fair to say that the magnitude of the drop was unexpected. And to the extent that we took furloughed workers and got them engaged again at their jobs, I’m grateful for those workers. I’m grateful for those employers. But there’s no question that these rising case counts are problematic, and we’ve got to get on top of it. And I think you have state leaders working hard on that every single day.
Chart 2. Job change
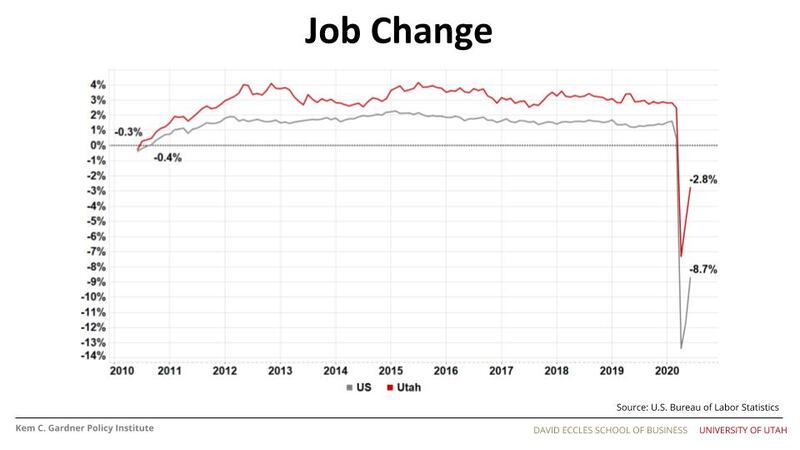
This is the job change. Generally this slide, for most of my career, has been labeled “job growth.” And I had to change to “job change” because of the negative numbers here. And this is what people would say: “Oh, this looks like a V shaped recovery.” You can see where you get that terminology because it’s a bounce back. But I don’t for a minute think that this type of rapid recovery is going to continue.
Chart 3. National job change comparison
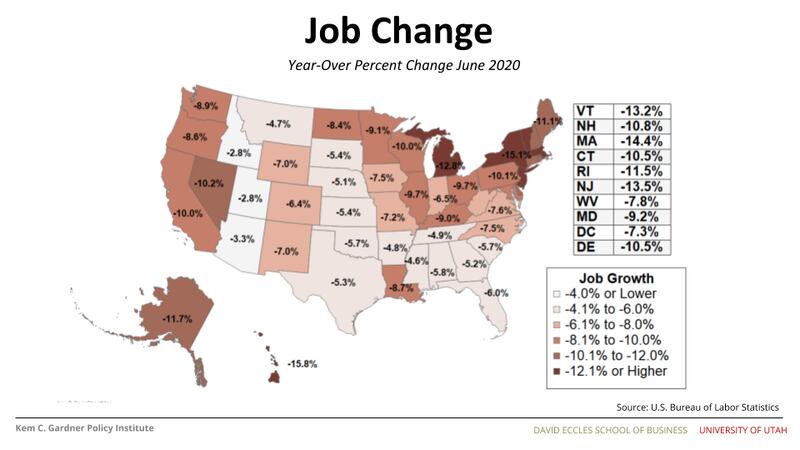
Do notice the relative difference as of June, the U.S. contracting by minus 8.7%, and Utah 2.8%. And when we look at it on a 50-state basis, you can kind of see Utah and Idaho showing the least amount of economic impact from the virus. The top question I will get is, Why is Utah’s economy doing relatively so well? And I think the answer to that is mostly that we were very well-positioned going into this crisis. We had our lowest unemployment rate in our state’s history going into this challenge. We have a very diversified economy. So look at Nevada here, contracting by over 10%, a very specialized economy based on travel and tourism. Ours is very diversified, and so tourism is struggling right now, energy’s is struggling right now. But you know, construction is growing in our state. So, you see kind of the relative differences there.
Chart 4. National unemployment rate comparison
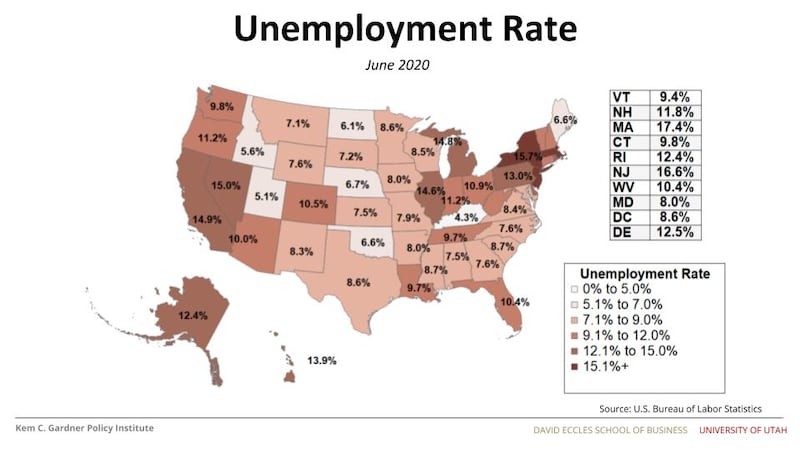
I want you to notice the relative differences between the U.S. unemployment rate that is greater than 11% and Utah’s just north of 5%. Here’s a map of all 50 states. And the lighter colored states are the ones with the lower unemployment rate. And you can see that we ended up having the second-lowest in June 2020. So this is a measure that shows a state that has tried its very best to minimize economic harm while trying to work through the very difficult challenge of the pandemic.
DN: The committee that gives recommendations to the White House included Utah as one of 18 states that was in trouble with the spread of COVID-19. And part of those recommendations were to tighten down the economy. As you look at the figures you’ve just detailed for us, is there a need to tighten down the economy?
NG: You know, that’s a tough question for me because I don’t see all the data. I think that from what I’m seeing, I’m seeing state decision-makers who are trying to really double down on the need for mask-wearing and they’re going to see what it does. So we’re really trying this important experiment about the social cohesion that exists in Utah. They’re spending a lot of money — you’ll see more and more of it spent on public messaging about it. ...The governor has been really clear. If by Aug. 1 this isn’t improved, he’s reassessing his policies.
Chart 5: Utah job change by industry
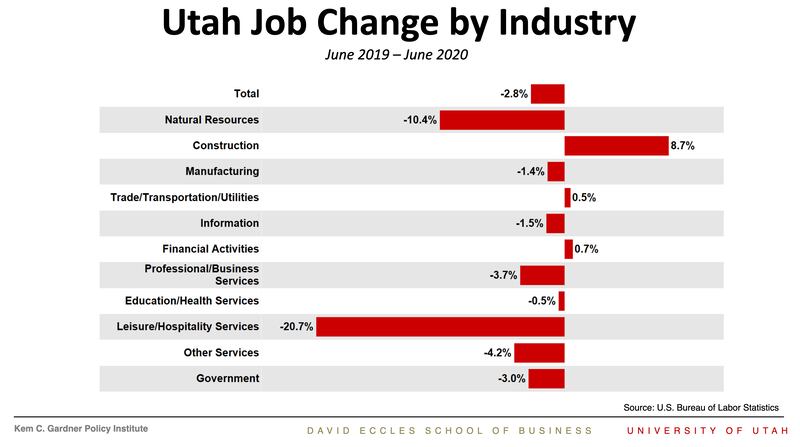
Here’s the industry makeup. It compares the number of jobs in 2020 and what were they in 2019 and shows the percent difference. And this is a far better picture than we showed 30 days ago, 60 days ago. But you can see the just gut-wrenching impact to leisure and hospitality.
Natural resources is mostly mining and it took a significant hit. So in June, we’re showing some mining distress, which is mostly Utah’s energy sector. Noteworthy is you see construction being a growth industry, as are financial activities, which is related to the CARES Act and how busy that made our financial institutions. We were even able to eke out a little bit of positive growth in our trade transportation utilities sector. This sector includes mostly trade.
DN: Are there industries that might not only have to radically change, but areas of business that you think might be in the buggy-whip category?
NG: Well, people will mention higher education. It’s going to have transformative changes. Retail of all sorts will change. People believe that over the long term malls will become more like fulfillment centers with the acceleration of remote sales.
Chart 6: Economic Bang for the Buck
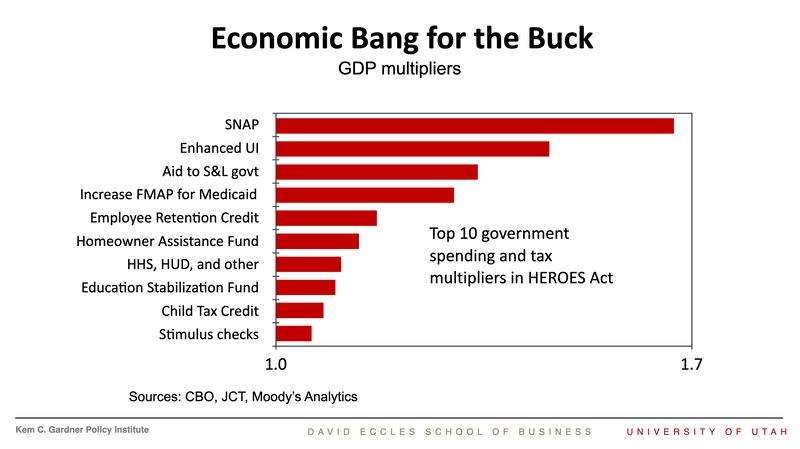
All eyes right now are watching what comes in the stimulus package, at least if you’re an economist, because we need another stimulus. We’re sideways. The virus has intensified. We’ve got nervous consumers. Hiring is set to slow even more. And we think that this setback could be a catalyst for more business failures. And so you’ve got to do some stabilization. And what we’re all watching for is what form does it take? How large is it? Do they get it done before the August recess? And then what do they spend it on?
The chart above — this data is coming out of the Congressional Budget Office and the tax committee — makes the point that some things have a greater multiplier than others. And what makes the difference is, do people spend it or do they save it? Saving does not create the multiplier effect. Spending it does. So the lower income things that you do are the most stimulative, and the things where people can actually hold on to that money are the least stimulative. And so these are the way that those are ranked. And so I’m hopeful this next stimulus is in the $1-1⁄2 trillion range. That when you combine it with the stimulus that we’ve already had, it would tally somewhere north of $4 trillion. It would make up about 20% of GDP all together.
DN: In that chart — the employee retention credit, does that cover the Paycheck Protection?
NG: Yes that’s right.
DN: Is that low on that list for how much money went into that program and how focused it was on keeping people off unemployment rolls?
NG: Again, I think it’s the same justification I’ve been saying. Don’t get overly concerned about how rigorous their multipliers are as they look at this. They analyze how much of what they put out gets spent quickly. And if you look at the ones above, they’re all very targeted to lower income, with the exception of state and local government. But then when state local government goes and makes their decisions, they tend to very much prioritize it and target it. And so it ends up being quite effective.