

Google has launched a new website that offered a look into how communities have responded to calls for social distancing, identifying where Americans are going during the COVID-19 outbreak.
What it shows:
- Google said the new website aims “to provide insights into what has changed in response to policies aimed at combating COVID-19.”
- The report shows chart movements over time broken down by geography. It also shows how often — compared to a baseline — people visit different spots, such as locations connected to retail and recreation, groceries and pharmacies, parks, transit stations, workplaces and residences.
United States during social distancing
In general, here’s how the people in the U.S. have reacted to social distancing. The numbers below reflected the change in time spent compared to a baseline.
- Retail and recreation: 47% less
- Grocery and pharmacy: 22% less
- Parks: 19% less
- Transit stations: 51% less
- Workplace: 38% less
- Residential: 12% more
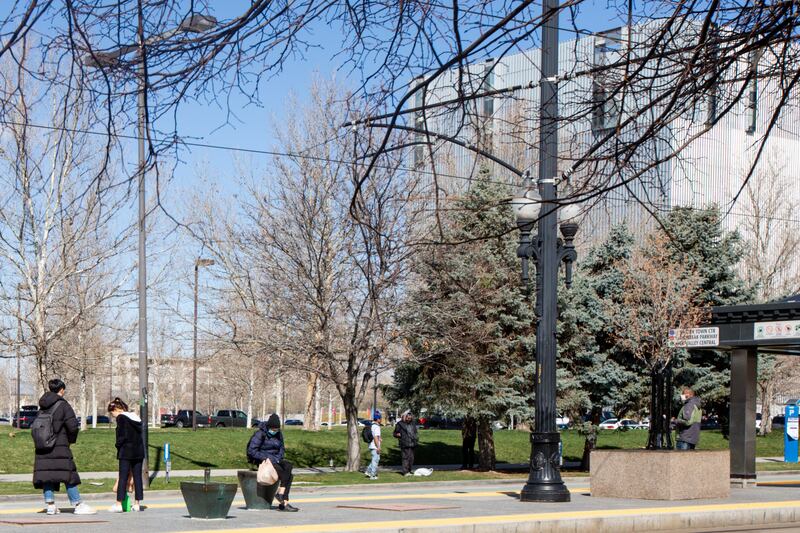
So what about Utah?
The following numbers represent how much time (more or less than the baseline) Utah residents are spending at individual locations, according to Google’s data.
- Retail and recreation: 41% less
- Grocery and pharmacy: 14% less
- Parks: 26% more
- Transit stations: 44% less
- Workplace: 40% less
- Residential: 10% more
Why it matters
- The numbers show Utah is a little behind where the rest of the country is going. Utahns only spend 10% of their time at home, compared to the country as a whole where people are spending 12% more time at home.
- Parks show the greatest difference. Utah has seen 26% increase in time spent at parks. For the entire country, people are spending 19% less time at parks.